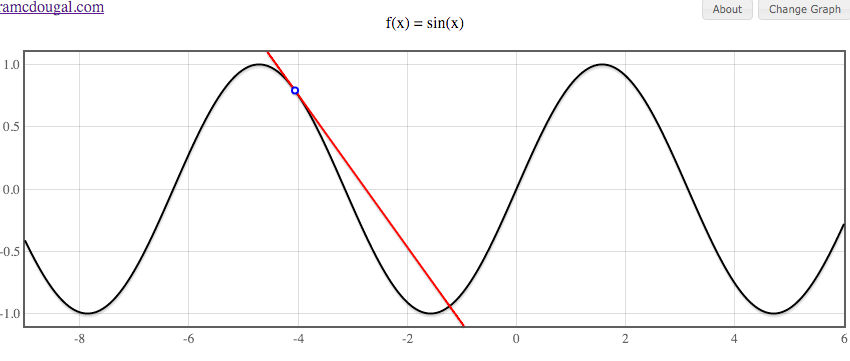
The tangent line to a curve at a point, if it exists, is the line that near the point always lies on one side of the curve. The slope of this line is equal to the derivative of the function. This demo allows one to choose a function, move the mouse across the curve to see how the tangent line changes, and optionally to plot the derivative of the function.
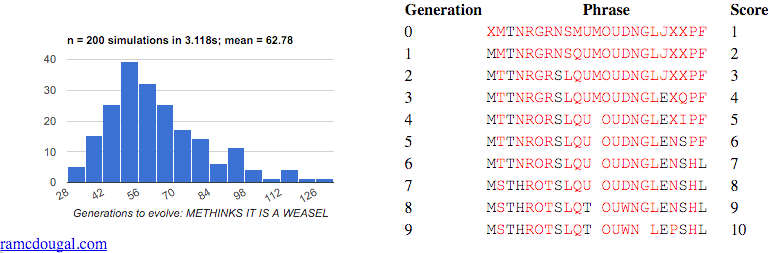
The Weasel Program is a demonstration of the power of evolutionary algorithms with an appropriate fitness function (i.e. survival rule). These algorithms find the solution much more efficiently than non-directed random mutation. This demo shows an example of the evolutionary process and approximates the distribution of convergence rates.
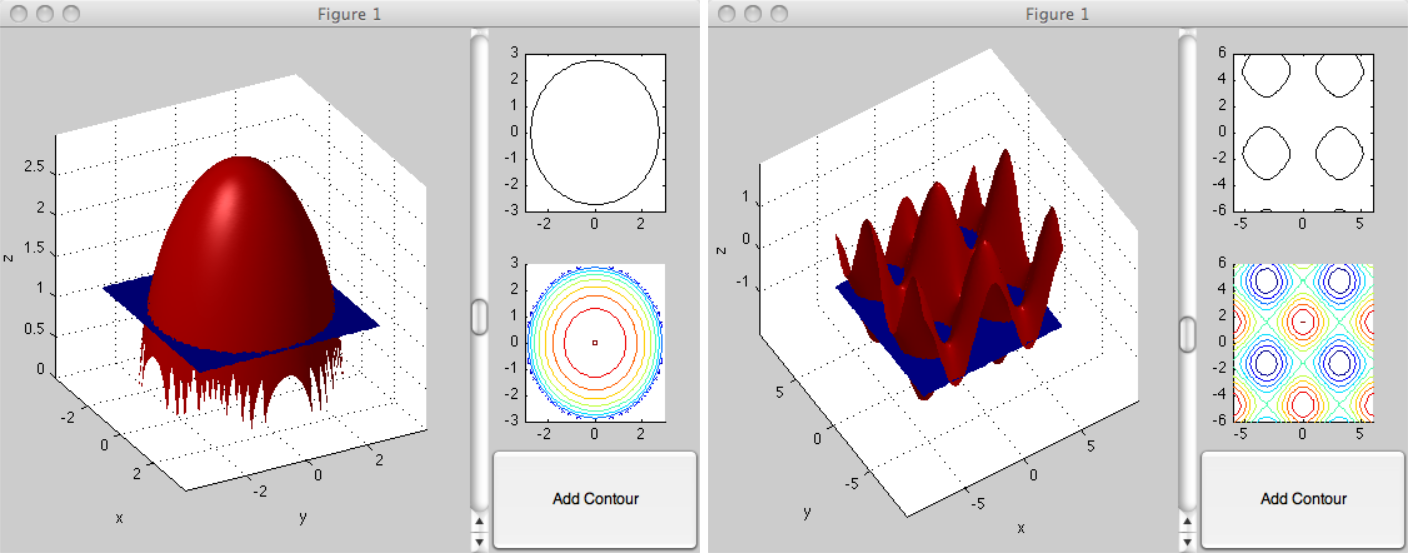
This MATLAB code illustrates the connection between 3D graphs and contour maps. The 3D graph may be rotated by dragging it. Move the scroll bar up or down to change the level of the plane. The screenshot on the left is from running demo1.m, and the one on the right is from demo3.m. The viewer supports visualizing arbitrary functions of two variables; see the demos for examples of how to call it.